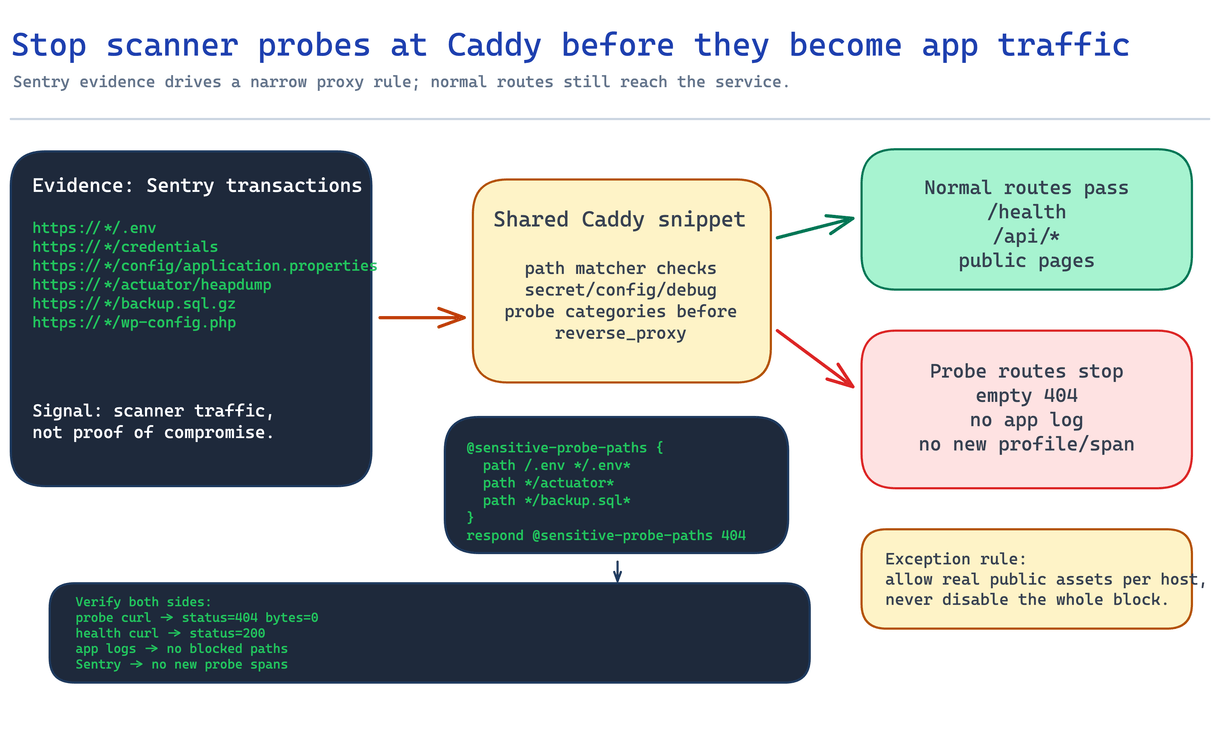
When repeated .env, credentials, actuator, and SQL dump probes showed up in Sentry Profiles, the easiest first move was to hide them in Sentry. But that only quiets the dashboard. The requests still reach the app container. So the standard for this change was not "build a security appliance." It was "end obvious scanner traffic at the reverse proxy, while verifying normal routes and exception policy."
Summary
- Problem: Sentry Profiles and spans repeatedly showed scanner paths such as
.env, credentials, config, actuator, and SQL dump probes. - Decision: Instead of hiding them in Sentry, it was better to return an empty
404from the shared Caddy layer in front of the app. - Verification: Normal routes and health checks still passed, while blocked probes no longer appeared in app logs or new Sentry profiles.
- Rule: A global blocklist can create false positives, so names that may be legitimate public assets, such as
config.jsorapp.json, need narrow host/path exceptions.
Context
While reviewing Sentry Profiles for a production service, I saw transactions that did not match user behavior.
https://*/.env
https://*/backend/.env.local
https://*/.config/gcloud/credentials.db
https://*/config/application.properties
https://*/app/actuator/heapdump
https://*/wp-json/gravitysmtp/v1/config
https://*/backup.sql.gz
These requests are not part of a normal user flow. There is no reason for someone clicking through the web app or calling the API to request .env, credentials.db, heapdump, or wp-config.php.
So I separated the conclusion into three parts.
- It is reasonable to treat this traffic as attack traffic or automated scanning.
- This log alone does not prove that the server was compromised.
- The goal is not incident response. The goal is to reduce unnecessary probes before they reach origin.
Why Not Only Hide It in Sentry?
The easiest option is to filter those transactions in Sentry. That makes the dashboard quieter.
But the request flow stays the same.
scanner -> reverse proxy -> app container -> framework routing -> 404 -> SentryIn that path, the app still receives the request, writes logs, passes through middleware, and may leave a profile or span. Even if the service does not actually expose those sensitive files, sending this traffic to the app every time has no upside.
So I moved the blocking point from Sentry to Caddy, which sits in front of the app.
scanner -> reverse proxy -> empty 404
normal user -> reverse proxy -> app container
This is not a replacement for authentication or authorization. The app still needs its own auth, routing, and permission checks. The Caddy blocklist is a defensive layer that reduces common public-internet scanner requests before they reach the origin app.
What Was Blocked
Blocking every suspicious-looking string from the start can break legitimate traffic. I grouped the rules by paths that had actually appeared in Sentry and by common probe patterns.
- Environment files:
.env,.env.*, URL-encoded.env - Cloud credentials:
.aws,.gcloud,.config/gcloud - Secret/config files:
credentials,service-account.json,application.*,config.*,settings.* - Framework debug endpoints:
actuator,heapdump,threaddump,_profiler - PHP/WordPress probes:
phpinfo.php,wp-config*,wp-json/* - DB/backup artifacts:
*.sql,*.sql.gz,dump.*,backup.*,*.zip - VCS/editor/deploy artifacts:
.git,.npmrc,.pypirc,.vscode,.idea,docker-compose*.yml,Jenkinsfile
The important point is that this list is not a security product that blocks every attack. It is a rule set that quickly ends the automated probes the service was actually receiving.
Caddy Rules
The production Caddy setup had multiple services behind the same reverse proxy. Instead of copying rules into each service, I made a reusable snippet.
Reduced for public writing, the structure looks like this.
(sensitive_probe_block) {
	@sensitive-probe-paths {
		path /.env /.env.* */.env* /%2e%65%6e%76 */%2e%65%6e%76
		path /.git* */.git* /.npmrc /.pypirc /.netrc /.vscode/* /.idea/*
		path /.aws/* */.aws/* /.gcloud/* */.gcloud/* /.config/gcloud/* */.config/gcloud/*
		path /actuator* */actuator* /heapdump */heapdump /threaddump */threaddump */_profiler*
		path /credentials */credentials */*credentials*.json */service-account.json
		path /application.* */application.* /config.* */config.* */config/application.*
		path */backup.sql* */dump.* *.sql *.sql.gz *.key *.zip
		path /local-config.php */config.php */settings.php */database.php */wp-config* *.php
	}

	respond @sensitive-probe-paths 404
}

example.com {
	import sensitive_probe_block
	reverse_proxy app:3000
}
The real production rule was longer, but the structure was the same.
- Put the sensitive-probe matcher in a shared Caddy snippet.
- Import it before each host's
reverse_proxy. - Return a body-less
404when it matches. - Send everything else to the existing app upstream.
According to the Caddy docs, matcher tokens limit the requests to which a directive applies. A named matcher such as @sensitive-probe-paths can group multiple path conditions for reuse. The path matcher is exact by default, so prefix or suffix behavior has to be expressed with *. That is why the rule splits patterns such as /.env, /.env.*, and */.env*.
respond @sensitive-probe-paths 404 writes a fixed response for matching requests. Because no body is provided, this returns an empty 404. The snippet is then inserted into each site block with import, which lets the same probe-blocking rule run before each host's reverse_proxy.
This is convenient when multiple services share one Caddy layer. A single change can give new services the same basic defensive layer.
Verification
For this kind of rule, verification matters more than adding the rule itself. A global rule can break normal routes, so I checked both blocked and allowed paths.
First I confirmed that representative probes ended as 404 responses with empty bodies.
curl -sS -o /dev/null -w 'status=%{http_code} bytes=%{size_download}\n' \
  https://<host>/%2e%65%6e%76

curl -sS -o /dev/null -w 'status=%{http_code} bytes=%{size_download}\n' \
  https://<host>/service-account.json
The expected result was:
status=404 bytes=0Then I checked normal routes.
curl -sS -o /dev/null -w 'status=%{http_code}\n' https://<host>/health
curl -sS -o /dev/null -w 'status=%{http_code}\n' https://<host>/
Finally, I checked app container logs and Sentry.
docker logs --since 5m <app-container> 2>&1 \
  | grep -E '/%2e%65%6e%76|/service-account\.json|/actuator|/wp-config' \
  || true
If the block works, probes stopped at Caddy should not appear in app logs. They also should not appear as new Sentry profiles or spans from the app.
A Deployment Trap
One issue I actually hit was the way the Caddyfile was deployed.
The production container bind-mounted the Caddyfile from the host. I replaced the host file with mv. From the host it looked like the file had changed, but inside the container Caddy was still looking at the old inode.
In that situation, caddy reload may not load the expected configuration. There are two safer options.
- Overwrite the existing file in place, then run
caddy reload. - If file replacement is necessary, restart the container so it remounts the file.
Changing the configuration file was not enough. I had to check the Caddyfile as seen from inside the container, run caddy validate, and confirm the actual curl responses.
False Positive Policy
The riskiest names in a global blocklist are generic file names.
For example, config.json, config.js, and app.json can be sensitive config probes in one service, but legitimate public assets in another. SPAs, PWAs, SDK documentation, and mobile app link flows may expose files with those names intentionally.
So I used this rule:
- If a public path needed by a new service conflicts with the blocklist, do not disable the whole blocklist.
- Add a narrow exception for that host and path.
- After adding the exception, verify both "the exception path passes" and "representative probes are still blocked."
Security rules last longer when operators can add narrow, safe exceptions instead of choosing between a broken service and disabling the entire rule.
How I Would Judge This Next Time
When attack-like transactions show up in Sentry, I do not need to immediately conclude that the service was compromised. Public servers constantly receive automated scanner traffic.
But "this is common, so ignore it" is not a good operating standard either. When these requests accumulate in profiles and spans, they make real performance or error signals harder to see.
If I see similar probe traffic again, I will check three things together.
- Observation: Build the blocklist from transactions that actually appeared in Sentry.
- Location: End the request quickly at the reverse proxy, not inside application code.
- Verification: Check blocked responses, normal routes, app logs, and Sentry re-entry together.
Even a small security change is easier to operate and explain later when it goes through those three steps.