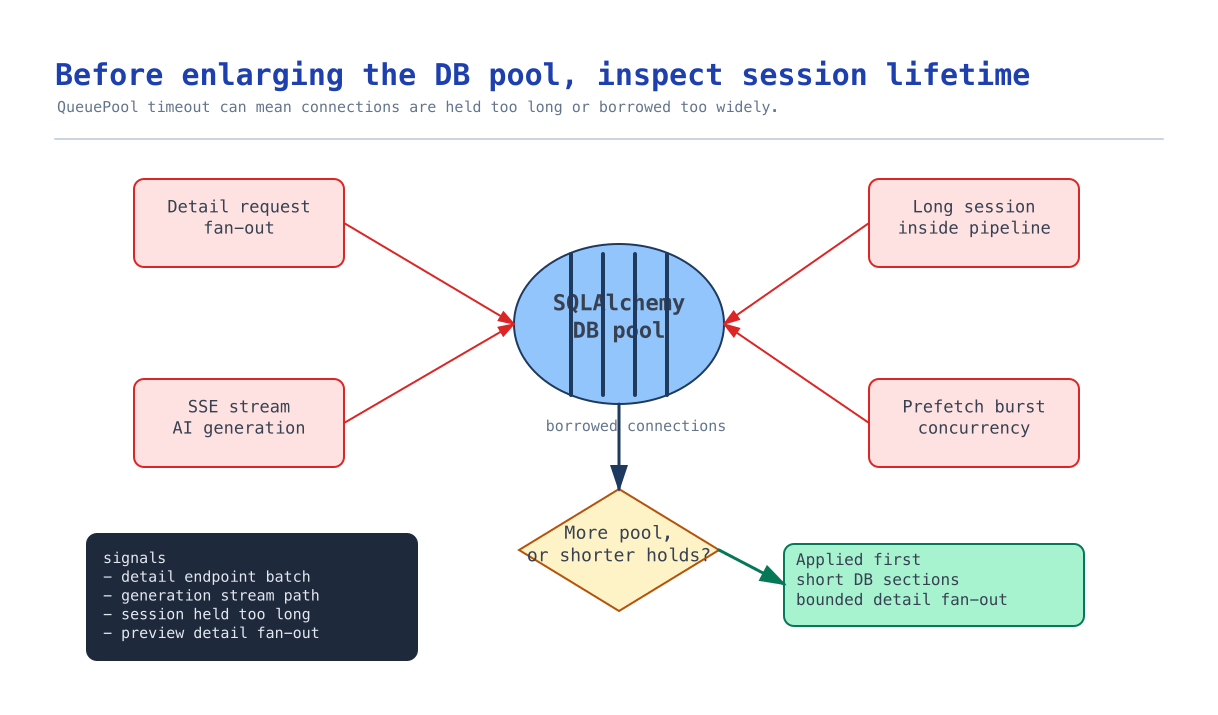
When SQLAlchemy QueuePool timeout appeared as a P1 issue in Sentry, the easiest fix would have been to increase the pool size. But grouping routes and timestamps showed that database capacity alone did not explain the issue. The first bottleneck was a DB session that stayed alive during external I/O. The remaining timeouts came from an operator screen fanning out detail requests and pressuring the same pool.
Summary
- Problem: In production, detail lookup requests and an SSE stream hit
QueuePooltimeout around the same time. - First judgment: Before increasing pool size, I checked whether sessions were holding connections for too long.
- Follow-up judgment: After releasing sessions earlier, the remaining timeout came from detail prefetch fan-out overlapping with stream polling.
- Fix: Close sessions around external I/O windows and limit detail request concurrency.
- Lesson: Pool timeout can mean "connections are held too long" or "too many are borrowed at once," not only "the database is too small."
Context
Place2Page has an operator screen for comparing generation results and inspecting detail records. While running several prompt experiments, Sentry grouped issues with this shape:
TimeoutError: QueuePool limit of size 5 overflow 10 reached,
connection timed out, timeout 30.00
Two route families were affected.
admin detail endpoint
generation stream endpoint
The first endpoint is used by operators to view generation details. The second is the SSE endpoint that sends generation progress. Even if the issue seemed to start from an internal operator flow, it was not safe to dismiss. If the shared pool dries up, it can affect the actual generation stream too.
Why I Did Not Increase Pool Size First
A connection pool reuses DB connections instead of creating a new connection for every request. A pool timeout means all borrowable connections were checked out and not returned within the timeout.
Increasing the numbers can make the symptom quieter for a while. But if code holds connections during non-DB work, or if one screen fires too many DB-backed requests at once, tuning pool size only delays the problem.
The SQLAlchemy error guide describes this error as a protection mechanism around the pool. I also checked FastAPI's yield dependencies. Request-scoped dependency cleanup runs after the response lifecycle, and StreamingResponse can keep the response open for a long time.
The local FastAPI Depends signature at the time did not have the newer scope="function" option shown in current docs.
Depends(dependency=None, *, use_cache=True)So I did not rely on a dependency option. I chose an explicit session.close() at a safe boundary.
Evidence 1: StreamingResponse Held the Session Too Long
The existing SSE route checked access before starting the stream.
ensure_access(session, project_id, user)

return StreamingResponse(event_generator(), media_type="text/event-stream")
The issue was that session came from a request-scoped dependency. Returning StreamingResponse does not immediately close it.
I first pinned this behavior with a test.
def test_stream_generation_releases_access_session_before_streaming(monkeypatch):
    session = Mock()
    request = Mock()
    user = SimpleNamespace(id="user-1", is_admin=False)
    ensure_access = Mock()
    monkeypatch.setattr(projects, "ensure_access", ensure_access)

    response = asyncio.run(projects.stream_generation("proj-1", request, session, user))

    ensure_access.assert_called_once_with(session, "proj-1", user)
    session.close.assert_called_once()
    assert response.media_type == "text/event-stream"
Before the fix, session.close() was not called and the test failed. After the fix, the route closed the session right after the access check. The stream itself already used separate short SessionLocal() contexts when it needed database access.
Evidence 2: AI Generation Was Inside the DB Session
run_generation() had a similar shape. The original structure ran the whole generation process inside one DB session context.
with SessionLocal() as session:
  read project
  read prompt/runtime settings
  fetch place data
  generate AI HTML
  save landing/debug log
place data fetch and AI HTML generation are external I/O, not database work. If the session stays alive during that time, it can keep occupying a connection.
I wrote a test that required the session to be closed before external fetch and AI generation. That test failed before the change and passed after the DB windows were separated from external I/O windows.
The final structure became:
DB setup window
  read project/runtime/profile
  close session

external window
  fetch place data

DB persist window
  save place snapshot
  close session

external window
  AI generation

DB persist window
  save landing/debug log
  close session
The code became a little longer. In return, the time holding a connection narrowed to actual DB work.
Evidence 3: The Remaining Timeout Was Fan-out
After the first fix, some issues in the same Sentry family still remained. Looking again, the session release guard for the stream endpoint was already in place, and writes for existing users were already limited.
The remaining evidence pointed to detail preview prefetch in an operator screen. When a detail-heavy tab opened, the page fetched up to 50 records at once. Each request performed an authorization lookup and a detail query. That fan-out overlapped with stream polling reads.
In a public-safe pattern, the Sentry log looked like this:
18:08:35  GET admin detail endpoint      200     30096ms
18:08:35  GET admin detail endpoint      200     30097ms
18:08:35  GET admin detail endpoint      200     30451ms
18:08:35  GET admin detail endpoint      failed  TimeoutError
18:08:35  GET generation stream endpoint failed  TimeoutError
If this had been a single slow query, I would expect one endpoint to appear long. Instead, a batch of detail requests from the same screen completed or failed around the 30-second pool timeout value. So I changed the frontend detail prefetch to use bounded workers and limited concurrent requests.
Verification
The two RED tests passed after the fix.
test_stream_generation_releases_access_session_before_streaming
test_run_generation_releases_db_session_around_external_generation_calls
I also ran the related test range.
cd apps/api && uv run pytest -q \
  tests/test_generation_service.py \
  tests/test_routers_admin_debug.py \
  tests/test_routers_projects.py \
  tests/test_projects_stream_state.py
The result was 183 passed, 1 warning. ruff check also passed for the related router and test files.
For the follow-up fan-out fix, I added a test to pin that detail prefetch does not exceed the configured concurrency.
The important part of this verification is not to overstate it as "pool timeout disappeared completely." What I verified was that the session release boundary and fan-out limit behave as intended.
How I Will Judge This Next Time
- When I see pool timeout, I will not increase pool size first. I will separate lifecycle issues from fan-out pressure.
- If Sentry shows multiple 30-second-range requests in the same second, I will suspect concurrency before a single slow query.
- For
StreamingResponse, background tasks, AI/provider calls, and external fetches, I will inspect DB session lifetime separately. - Even operator screens can pressure the production pool if they over-prefetch DB-backed detail endpoints.
- After reducing lifecycle length and limiting fan-out, if normal traffic still needs more capacity, then I will tune pool size, worker count, and database max connections.