Place2Page's project dashboard is one of the default paths users hit after signing in. That screen calls /v1/projects to render the project list.
While reviewing Sentry, I noticed a small but useful signal. In the most recent 24 hours, DB span p95 was still in single-digit milliseconds, so this was not an outage. But over a 30-day window, old /v1/projects queries kept showing up with a shape that loaded the full projects row.
The issue was not the number of rows alone. The endpoint only needed small fields such as project name, status, slug, and updated time. But the ORM was materializing the full Project model, including large JSON columns such as place_data_json and review_signal_payload_json.
The Numbers First
From production Sentry DB spans:
| Baseline | Old full-row query | New projected query |
|---|---|---|
| p95 | 144.8~214.5ms | 3.09ms |
| Large JSON columns | included | excluded |
| Optimization | full-row load | required-column projection |
This is not full API response latency. It is DB query duration inside /v1/projects. At the time, Sentry transaction names did not cleanly separate GET /v1/projects from POST /v1/projects, so full request latency could be mixed with generation requests. For this post, I only use the DB query shape and DB span duration as production evidence.
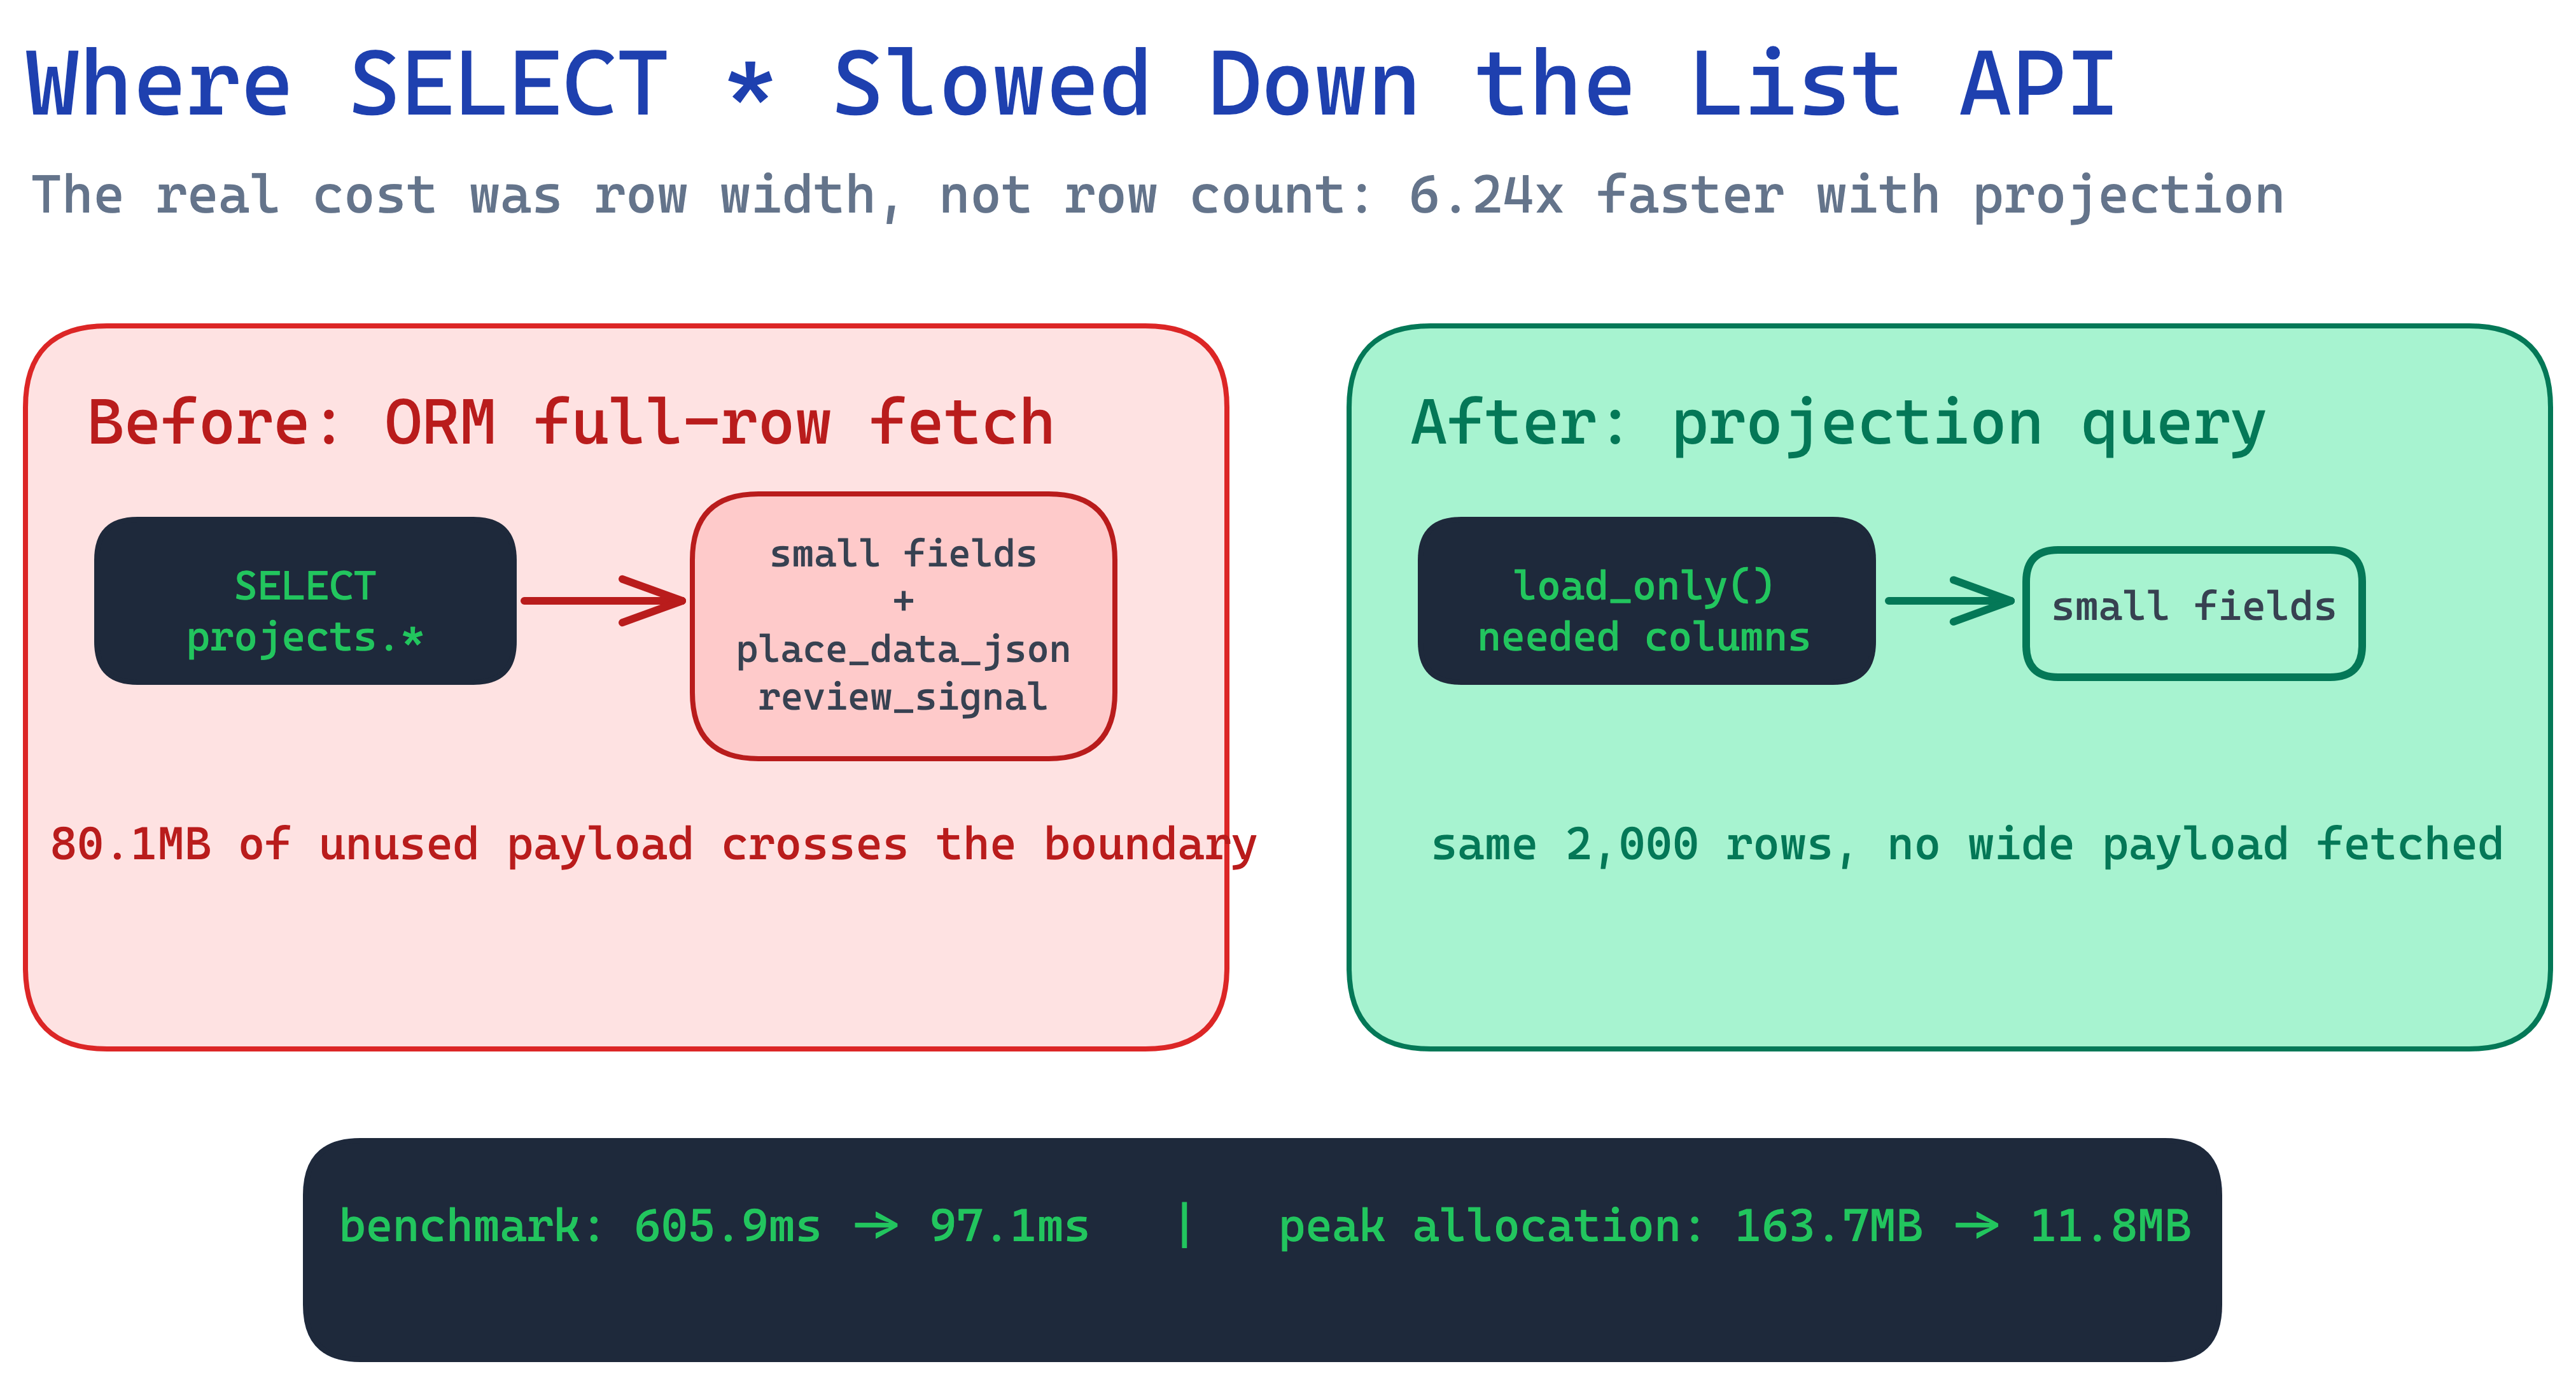
I also ran a local synthetic benchmark with the same schema and intentionally wide rows. The absolute numbers are not meant to reproduce production PostgreSQL throughput exactly, but they isolate the difference between full-row fetch and projected fetch under the same conditions.
| Metric | Before | After |
|---|---|---|
| median elapsed | 605.9ms | 97.1ms |
| median peak allocation | 163.7MB | 11.8MB |
| result rows | 2,000 | 2,000 |
| avoided wide payload | 80.1MB | 0MB fetched |
Sentry confirmed that the production query shape changed. The local benchmark showed how expensive that shape becomes as row width grows.
Why Projection Came Before Indexing
Once you get comfortable with an ORM, loading a full tuple from the database and mapping it into a DTO can start to feel like the natural programming pattern.
That makes it easier to stop noticing the actual SQL being executed, including whether the query is reading columns the response never uses.
From a database cost-model perspective, unnecessary columns increase tuple width. Even when row count stays the same, wider tuples mean more I/O, larger memory allocations, and more serialization work.
So this was not primarily a cardinality problem. The number of rows could stay identical while each row remained too wide. If the DB driver and ORM have already moved a wide tuple into the application, a small response DTO does not undo that cost.
In database textbooks, projection is introduced as the relational-algebra operation that keeps only the attributes required by the result. In an API server, that logical idea has a physical consequence.
logical projection:
  keep only the attributes required by the result.

physical consequence:
  shrink the data width that the DB reads, the driver transfers,
  the ORM materializes, and the serializer processes.
The core question was therefore not "how do I find these rows faster?" It was "what should I stop reading after finding them?"
What Changed
The old route used session.query(Project), which loaded the full model. Even if the response schema was small, the ORM had already materialized the full row.
The fix used SQLAlchemy's load_only() to restrict the columns eagerly loaded by the list endpoint.
q = session.query(Project).options(load_only(*_PROJECT_LIST_LOAD_COLUMNS))
if not user.is_admin:
    q = q.filter(Project.owner_user_id == user.id)
projects = q.order_by(Project.updated_at.desc()).all()
I also had to avoid accidental lazy loads. A property such as Project.place_provider can read place_data_json internally. If the list route touches that property, load_only() can collapse into one deferred-column load per row.
For the list path, I switched provider inference to use the URL only, without reading the large JSON payload. The detail page still keeps the full project context.
Why I Deferred the Index
The next candidate was a composite index. The non-admin query generally follows this pattern:
WHERE owner_user_id = ?
ORDER BY updated_at DESC
For that shape, (owner_user_id, updated_at DESC) is a natural composite index. It can help filtering and ordering at the same time by reducing scan range and sort cost.
I did not add it in this pass. Projection alone moved the recent production DB span p95 down to 3.09ms, and the matching ordered SELECT did not appear in the most recent 24-hour sample. An index could still improve reads, but it would also add write amplification and migration-management cost.
At the current data size, adding the index felt like overkill. If project volume grows and /v1/projects becomes a top DB span again, then adding (owner_user_id, updated_at DESC) would be the next step.
Product Impact
This optimization was less about making one isolated request faster and more about reducing unnecessary payload and memory allocation on a repeated default path.
The project dashboard is loaded whenever users enter the product. If that path repeatedly reads large JSON payloads and materializes them into Python objects, the cost shows up not only as latency but also as worker memory pressure, GC pressure, and serialization overhead.
The important part was not that I used load_only(). The important part was identifying the production query shape in Sentry, connecting it to row width through the database cost model, and reducing the actual data read by the endpoint.
Performance work is less about knowing a faster trick and more about choosing which cost to reduce first. In this case, projection came before indexing.
References
- Abraham Silberschatz, Henry F. Korth, S. Sudarshan, Database System Concepts, 7th edition, Chapter 15 Query Processing
- SQLAlchemy ORM Querying Guide: Column Loading Options
- Sentry trace search:
environment:production span.op:dbonplace2page-server