Our marketer had started building a back-office view that pulled Growth-related information into one place. I ended up finishing the unresolved engineering parts. The unfamiliar part was not querying a database. It was combining Google Analytics, Mixpanel, and Google Search Console with product and planning context. That path was much less like a normal app-server query than I expected.
The plan lived in Notion. The actual customer state lived in the database. Traffic lived in GA. Search performance lived in Search Console. Product events lived in Mixpanel. Answering a simple question like "what should we look at this week?" still meant opening several tabs.
Growth OS was meant to change that. Notion would hold planning and actions. Growth OS would show results and metrics. But once GA and Search Console entered the picture, it became clear that "connect an external analytics API" is not just one successful request. Credentials can break. Permissions can disappear. Refresh jobs can fail quietly. The screen should not collapse along with that failure.
This work was about making the Growth screen less fragile in the face of external analytics failures.
Where I Was Initially Confused
At first it looked like a cadence problem:
- Should the server prefetch on a schedule?
- Should it fetch on every user view?
- Should it show stored values first and refresh in the background?
But after a second look, cadence was not the real issue. Whether data was pulled on a schedule or on demand, both strategies still depended on the same brittle Google fetch path. If authentication or authorization broke once, neither strategy was actually stable.
A scheduled job also had an operational downside: if it failed while nobody was watching, it was hard to tell whether the numbers were old, refresh was broken, or there really was no activity.
Fetching live on every request had the opposite problem. It tied the dashboard to Google API latency and quotas. Growth OS is meant to be scanned quickly. I did not want every page load to wait on analytics APIs.
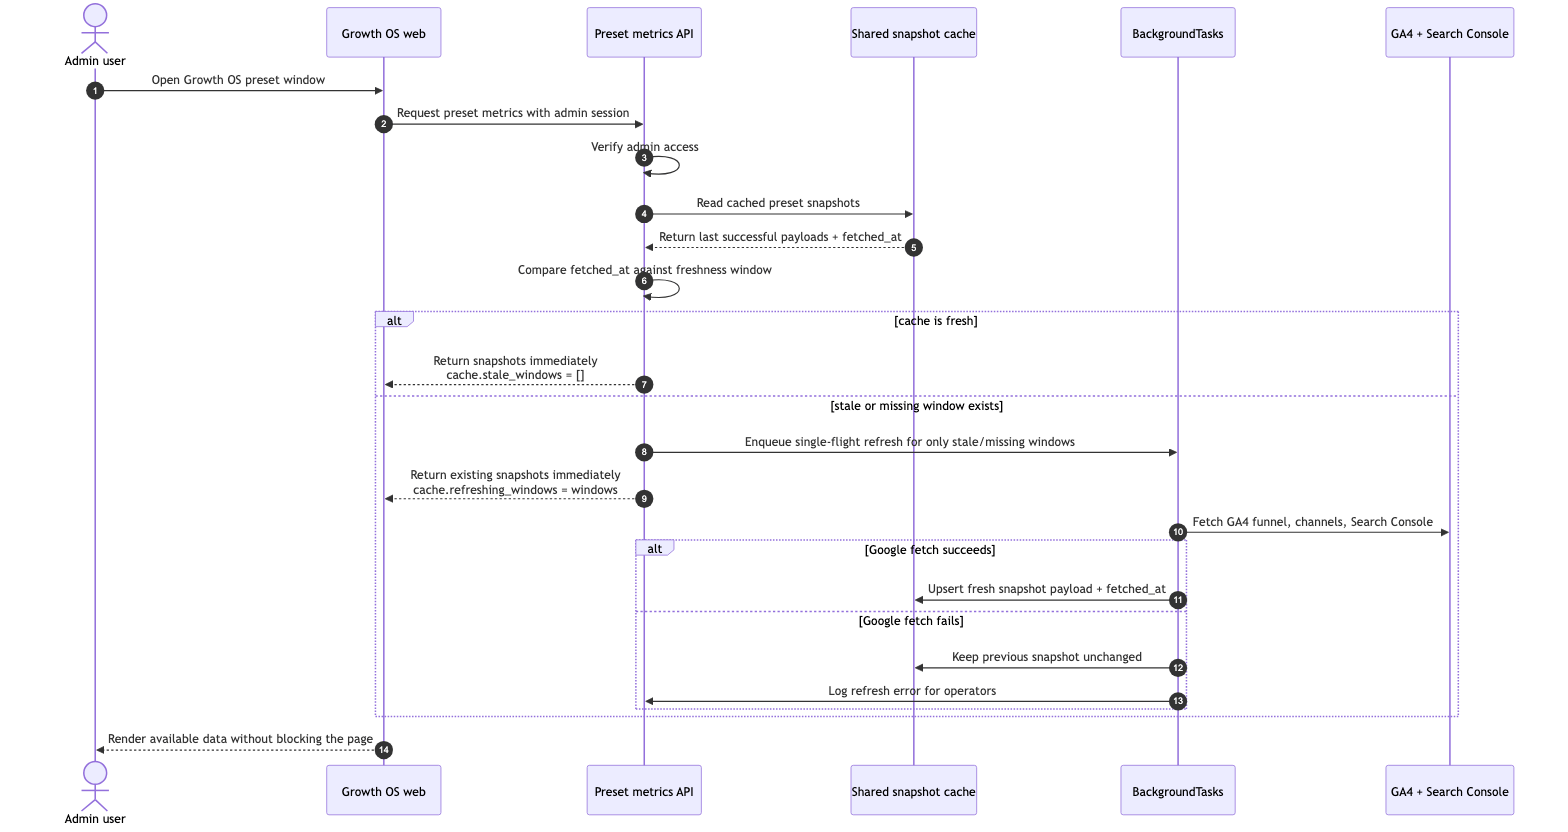
So I changed the structure. The screen always reads a stored value first. If the data is missing or stale, the server refreshes in the background. If refresh fails, the previous snapshot remains visible.
The Structure I Switched To
For preset date ranges, GA and Search Console data now use a stale-while-revalidate model on the server.
When someone opens Growth OS, the server reads the latest cached values from a shared cache table and returns them immediately. That response does not wait for Google APIs.
If the cache is stale or missing for a requested range, the server triggers one refresh in the background after returning the response. If it succeeds, the next viewer gets fresh data. If it fails, the previous good value stays in place.
The contract of the screen became:
- show something first
- fix stale values in the background
- do not destroy the last good snapshot on refresh failure
- avoid duplicate refreshes when multiple people open the same range at once
The sequence diagram at the top is a compressed version of that flow.
Why the Cache Belongs on the Server, Not in the Browser
I did consider a client-side version first: show the last stored value, then let the browser silently fetch fresh data and swap it in.
That is fine for some UI patterns. It is the wrong boundary here.
Growth OS numbers are not personalized. Team members should all be looking at the same metrics. That means the freshness state also should not be different in each browser tab.
If every browser performs its own live fetch, the same request multiplies as usage grows. Failure handling becomes fragmented across clients. Worst of all, "when was this number last refreshed?" stops being a shared server-side fact and becomes a per-tab state.
That is why the cache belongs in the server and database. Repeatedly viewed preset metrics should read from shared cache. Ad hoc date ranges can still be queried live because they behave more like one-off investigative questions than like shared operational metrics.
The Permission Problem Was Not Just "Authentication"
The most confusing part of this work was Google access.
It is easy to think "we have a service-account key and the server can mint a token, so authentication is done." But that only proves identity. It does not prove the right to read a GA4 property or a Search Console property.
If you treat those as one blended problem, debugging gets slow. In practice, there were three separate gates:
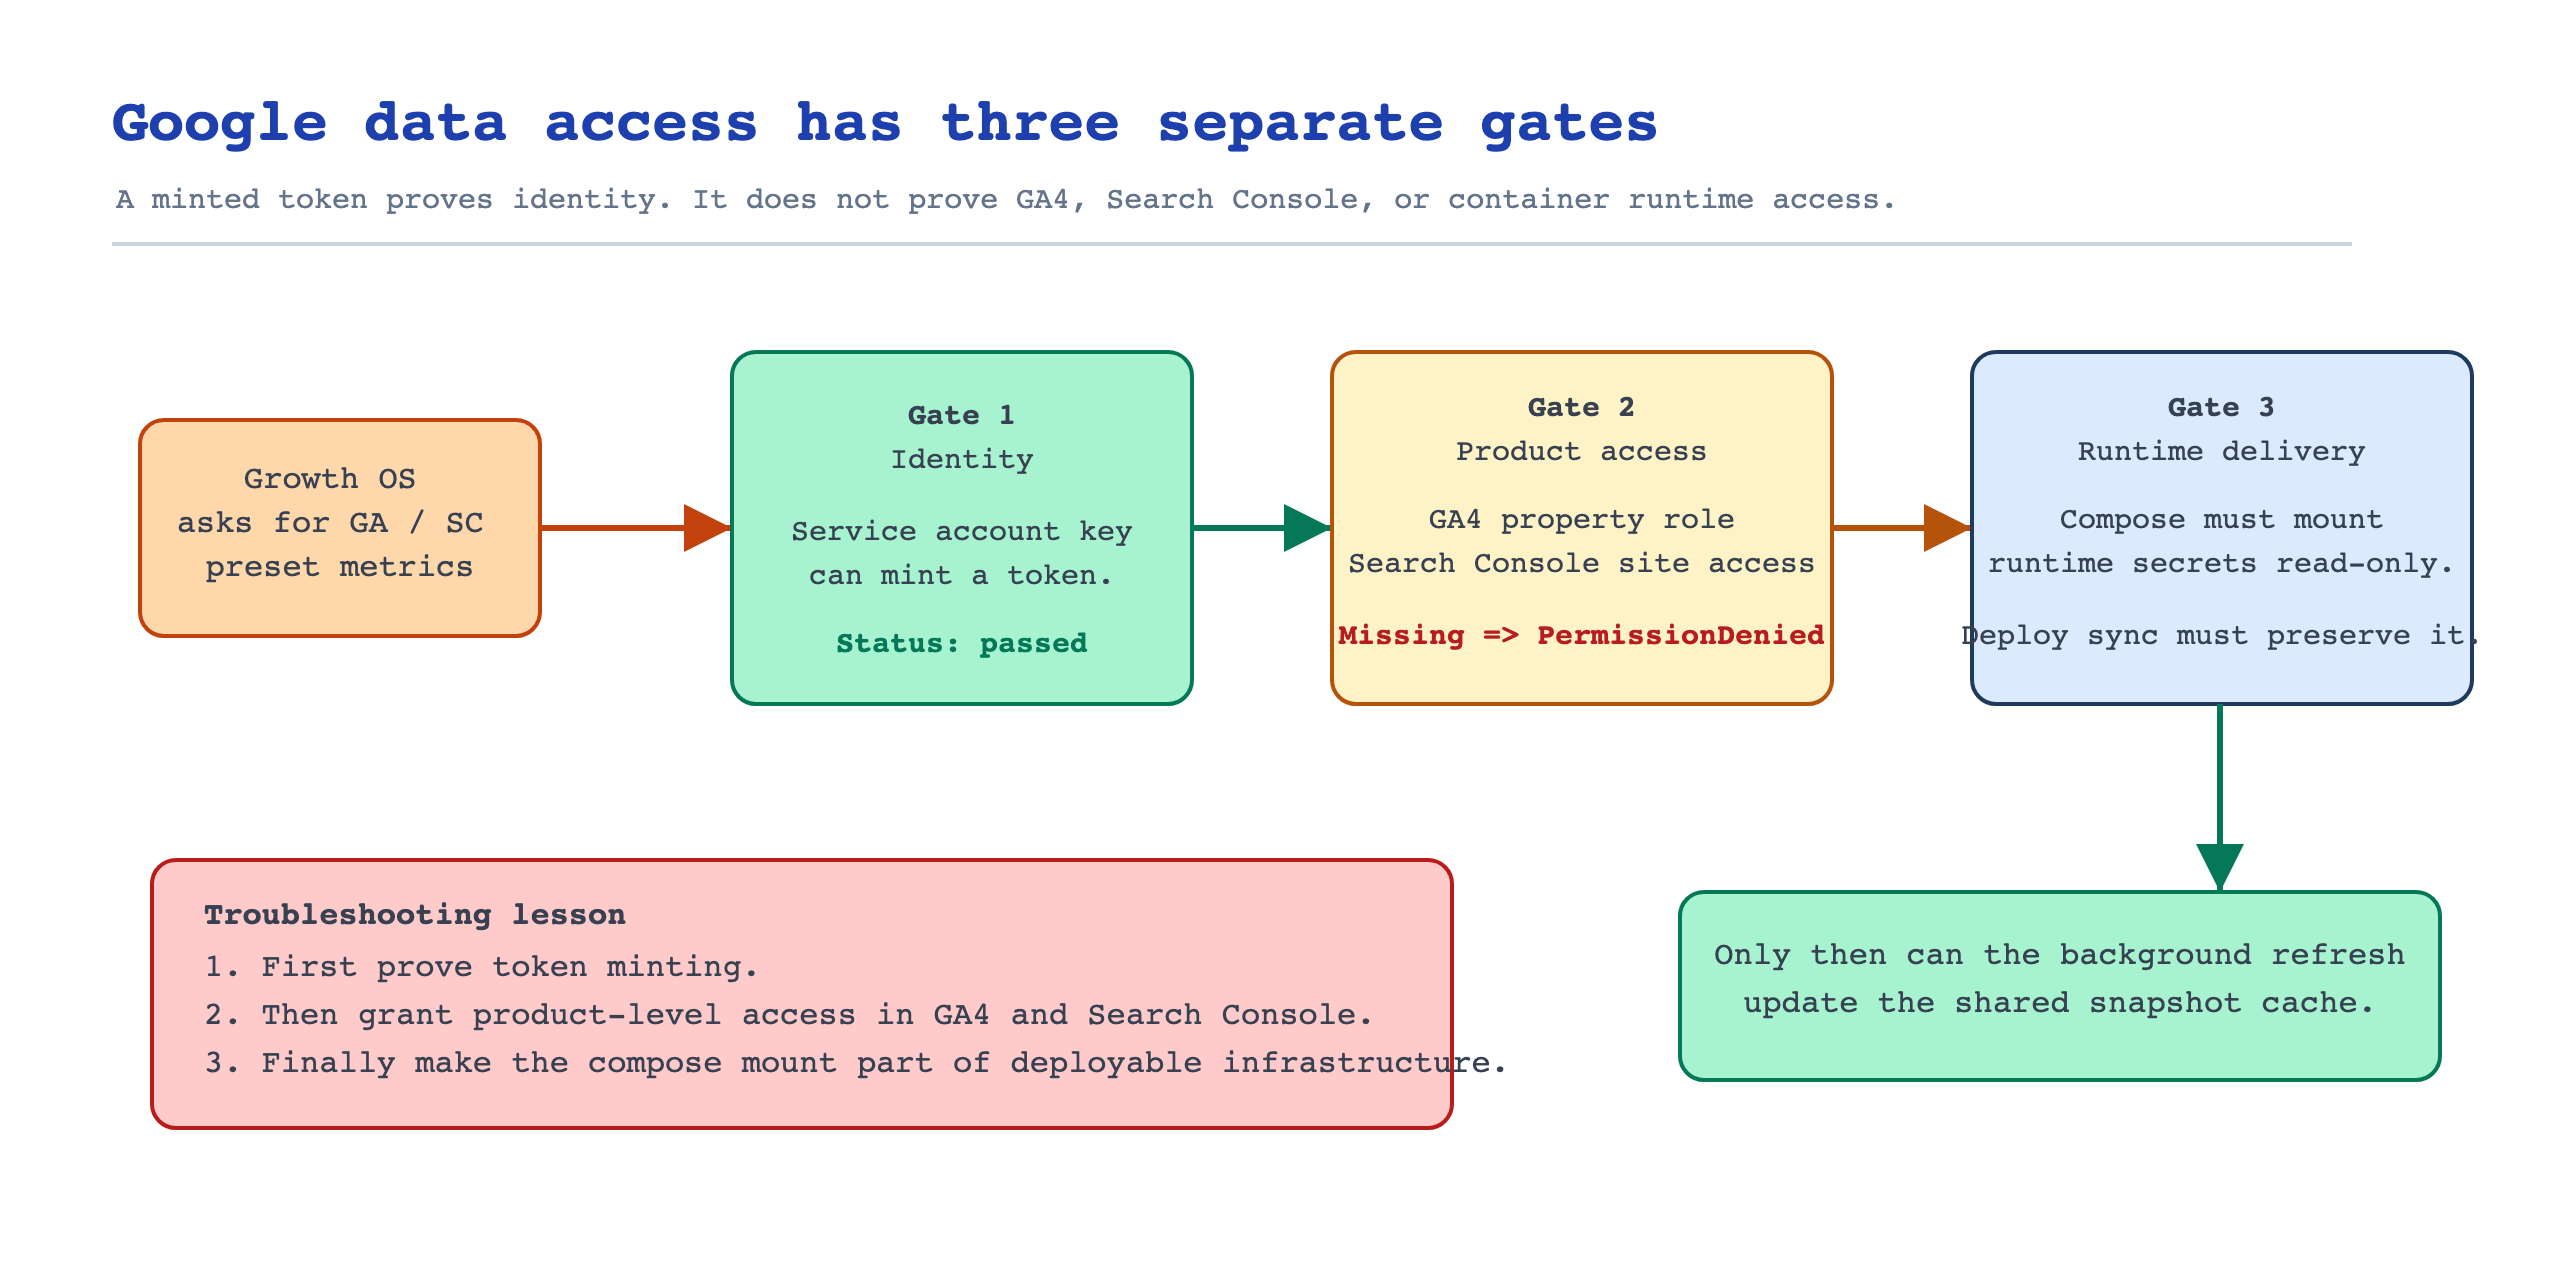
The first gate is identity. The server must be able to read a credential and mint a Google token.
The second gate is product access. That identity must also be authorized inside GA4 and Search Console.
The third gate is runtime delivery. The deployed container must actually receive and read the credential file. A manual fix on the server can vanish at the next deploy if the secret mount is not part of the deployable infrastructure definition.
Once those became separate checks, the debugging path got much shorter:
- can the identity mint a token?
- does it have product-level access?
- can the running container read the credential at deploy time?
The Standard I Used While Implementing It
The most important standard in this work was not "how fast can we fetch the newest number?" It was "what failure mode should the screen have?"
Growth OS is an operations cockpit. When a user opens it, the first thing they should not see is an empty dashboard or a crash because an external analytics API had a temporary problem.
That led to these rules:
- the preset metrics screen should not wait on Google APIs
- refresh failure should not overwrite the previous good value
- the same range should not refresh several times concurrently
- authentication, product authorization, and runtime credential delivery should be verified independently
Once I set those rules, cron became a supporting tool instead of the main path. It can still be useful for backfills or manual recovery, but the dashboard should not depend on a daily scheduled job quietly succeeding.
What I Verified After Deploy
I did not stop at code-level testing. I checked the running production container directly.
I verified that the credential file was readable inside the container, that preset metric responses included cache-status information, and that both GA and Search Console values appeared in the response.
The final behavior was:
- the UI returned the stored snapshot immediately
- the cache state was fresh
- GA and Search Console values were both populated for preset ranges
The important claim here is not just "numbers showed up." The more important change is what happens the next time Google fetch fails. The screen now keeps serving the previous successful snapshot. The failure shows up in logs and cache state instead of turning the dashboard into an empty surface.
What I Deliberately Left Out of the Public Write-Up
This post does not include:
- the actual service-account email
- the GA property ID
- the DNS verification token
- the credential filename or absolute server path
- repository or server secret values
- internal API route names
The useful lesson is not the identifier itself. It is the boundary: what permission is needed, what order the checks should follow, and which failure modes the UI must survive.
Next Time
When connecting external analytics APIs to a product surface, I will not start with "does the API call work?" I will start with "what state does the screen hold when refresh fails?"
Cron is simple, but it can fail quietly. Live fetch on every request is fresh, but it couples the UI to external latency. For a shared operational dashboard, a DB-backed stale-while-revalidate cache is a better default.
And I will keep Google access split into separate gates:
- token minting is identity
- GA4 and Search Console access are product permissions
- container-side credential readability is runtime delivery
When those are separated explicitly, the debugging path becomes much shorter.
Growth metrics screens should behave like an operations cockpit, not like a thin Google API client. A cockpit should keep showing the last trustworthy state even when one of its external instruments starts failing.