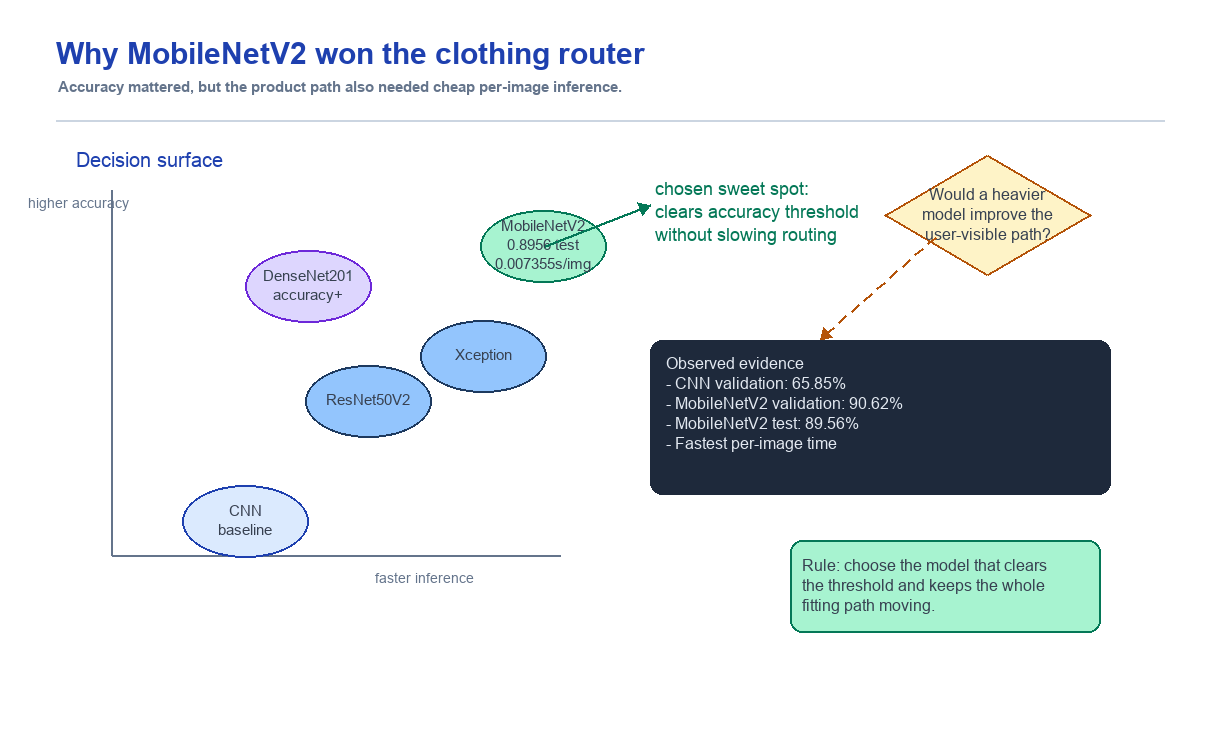
The ThatzFit garment classifier was not a feature for showing off model performance. It was a routing gate before virtual try-on. At first, choosing DenseNet201 because it had the highest test accuracy looked natural. But the real product bottleneck was not classification. It was the virtual try-on step after classification. The decision changed from "pick the most accurate model" to "pick the lightest model that avoids serious routing failures."
Summary
- Problem: I needed a fast routing model that sends garment images into the right virtual try-on flow, such as tops or bottoms.
- Decision: I treated roughly 90% accuracy as the threshold, then weighted downstream cost and inference time more heavily.
- Result: DenseNet201 had higher test accuracy, but MobileNetV2 had the better balance of validation accuracy, inference time, and experiment iteration cost.
- Lesson: Model selection is not a leaderboard decision. It has to include what happens in the product when the model is wrong.
Context
ThatzFit needed a classifier that could route a user-uploaded garment image into the right virtual try-on flow. For example, a pants image should go to the bottoms flow, while a shirt or outerwear image should go to the tops flow.
I started with a simple CNN baseline, then compared several transfer-learning models pretrained on ImageNet. The final candidate had to be more than accurate. It also had to make a quick decision inside the service.
Problem
Garment classification is not the core user-visible task. Most of the waiting time happens in the virtual try-on model. The classifier still needs to be accurate enough, but making it too heavy slows down the entire fitting flow.
The experiment had two criteria.
- Accuracy should be high enough for practical use.
- If accuracy is similar, choose the model with shorter inference time.
Data
The dataset contained 4,500 garment images. I used 4,050 images, or 90%, for training and 450 images, or 10%, for testing.
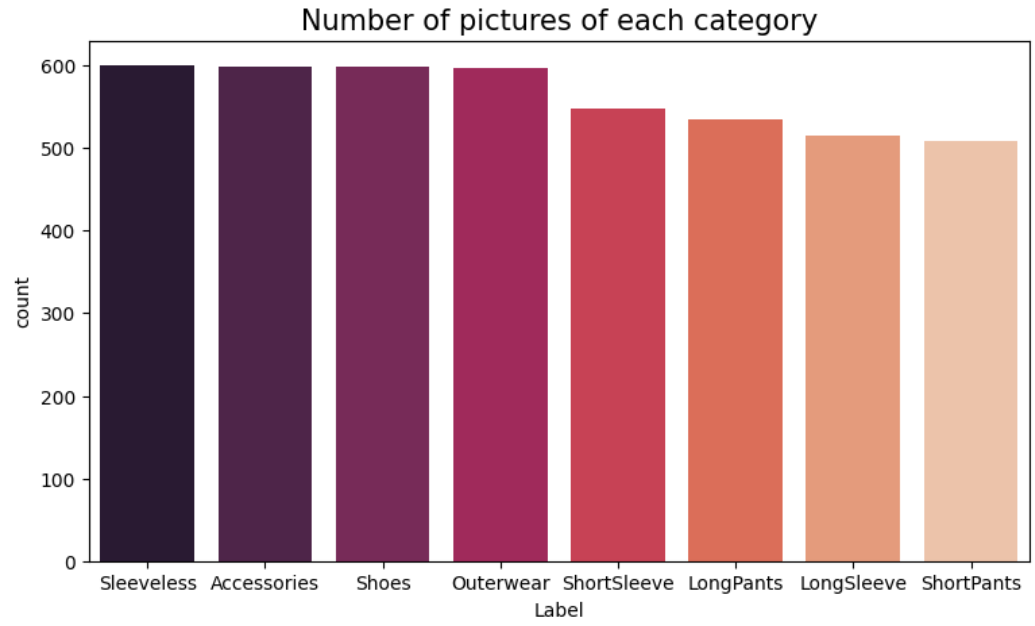
There were eight classes.
- LongPants
- Sleeveless
- Outerwear
- Accessories
- ShortPants
- ShortSleeve
- Shoes
- LongSleeve
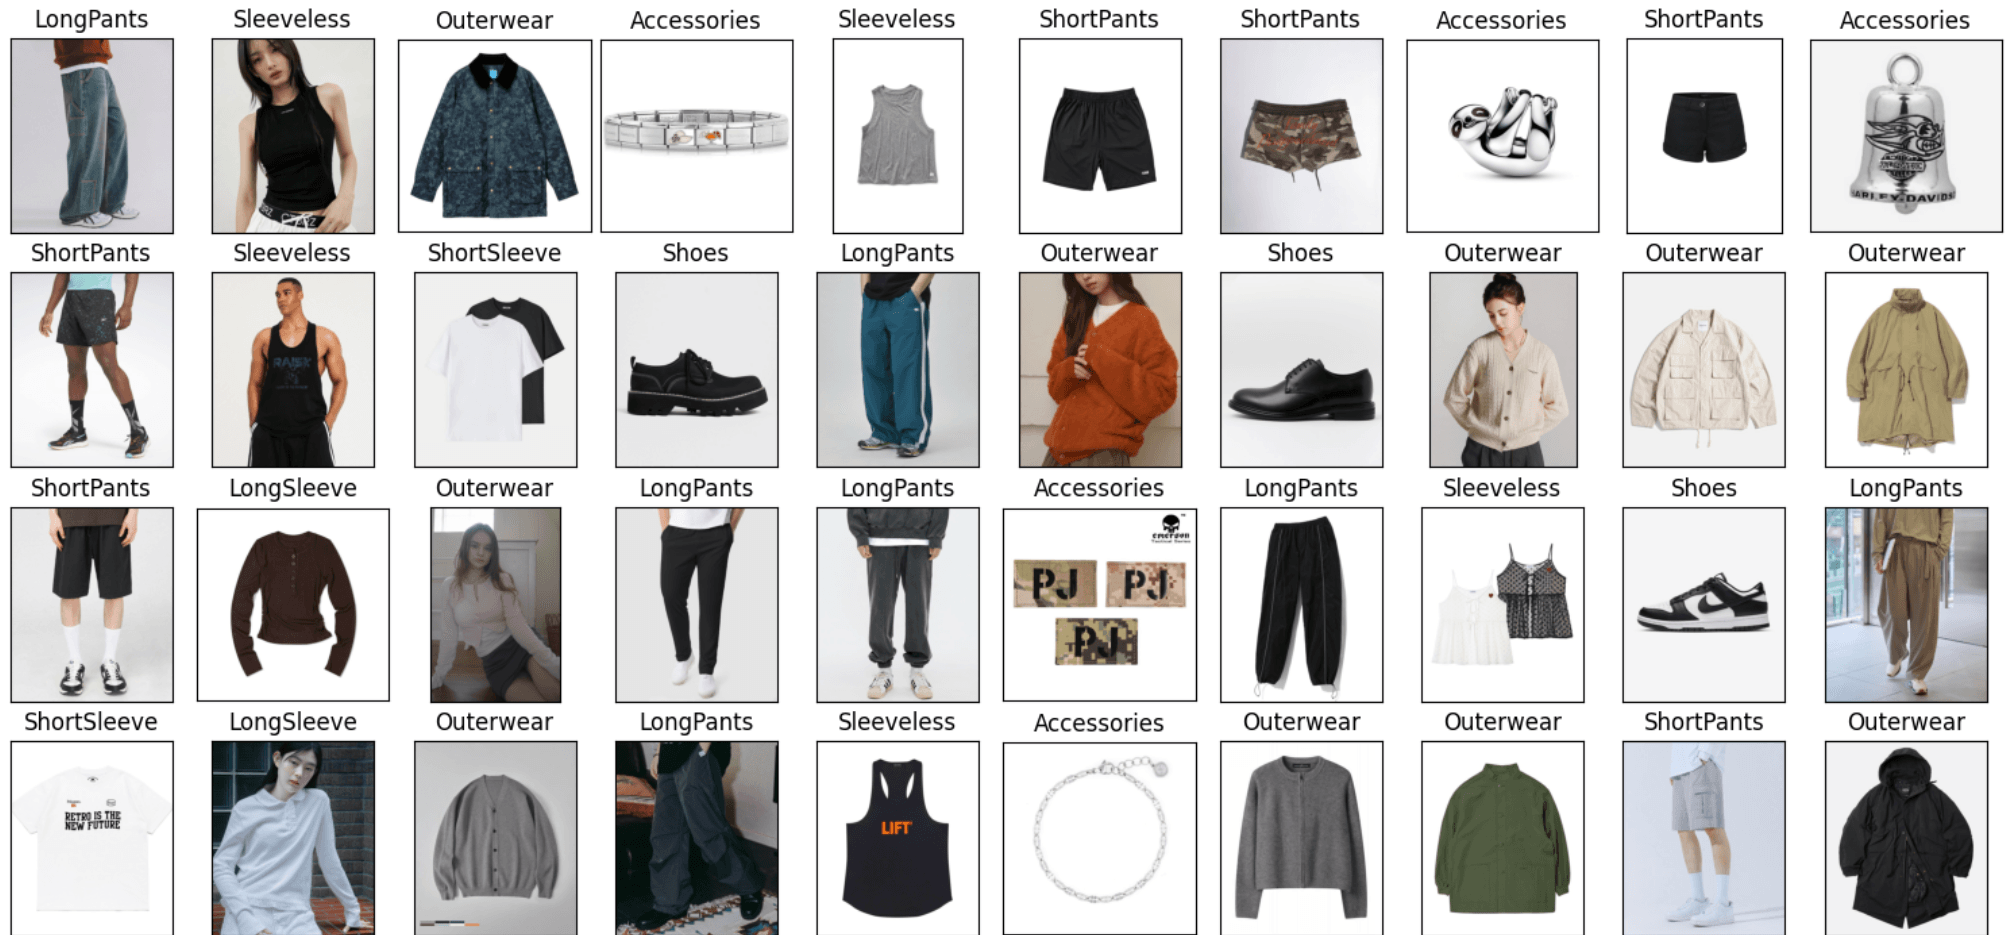
During training, I used image augmentation such as rotation, zoom, shift, and horizontal flip to reduce overfitting.
Criteria
I split the metrics into two types.
The first was a threshold-based metric. I treated accuracy around 90% as potentially usable in practice. This was the minimum line for a routing model that should not make major garment-flow mistakes.
The second was an optimization metric. Lower inference time was better. In ThatzFit's full flow, VITON-based virtual try-on is much heavier than image classification, so the classification step should finish as quickly as possible.
The final selection rule was:
Among models near or above 90% accuracy, choose the one with the shortest inference time.
Baseline
I first trained a simple CNN baseline. It used two Conv2D layers with MaxPooling, then a Dense layer for the eight classes.
After 10 epochs, the result was:
| Model | Training Accuracy | Validation Accuracy |
|---|---|---|
| CNN baseline | 97.85% | 65.85% |
The gap between training accuracy and validation accuracy was large. The baseline was quick to build, but it was not good enough for a service model.
Model comparison
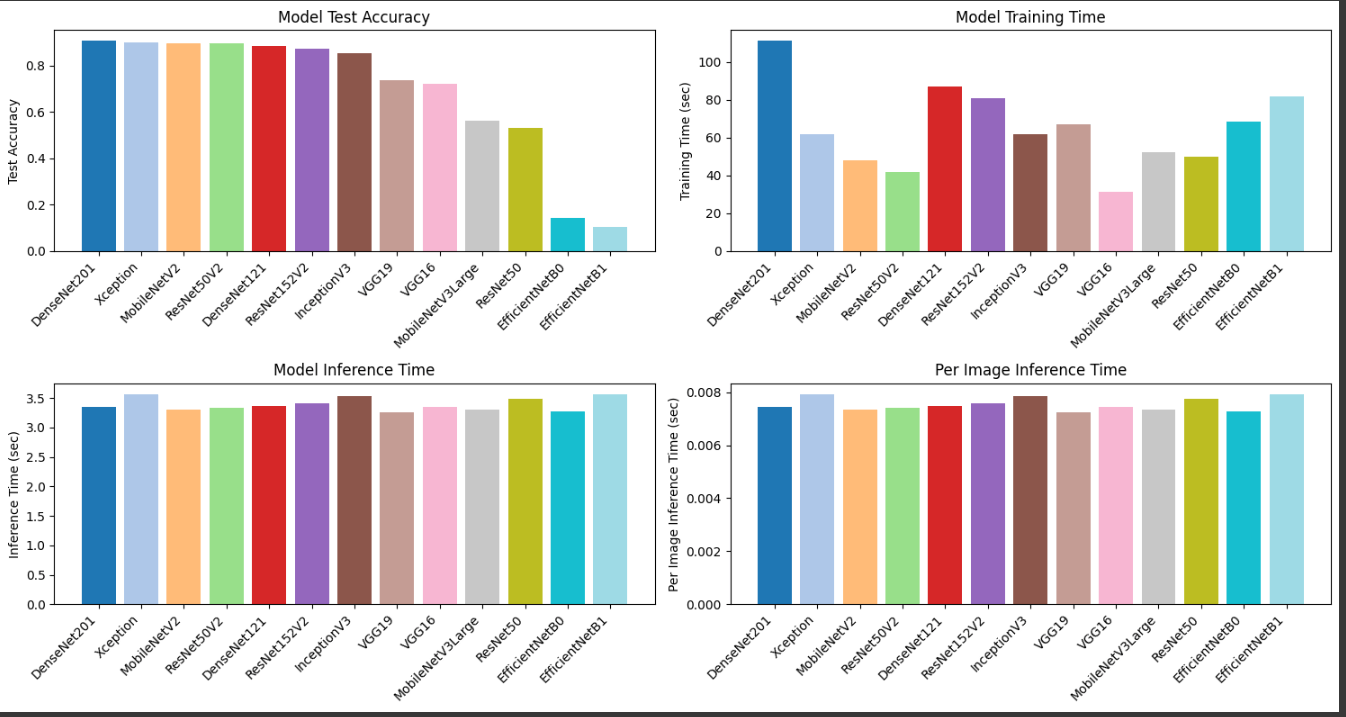
For the transfer-learning models, I used ImageNet pretrained weights and trained a new classification head. I compared 13 pretrained models in total. The table below shows the stronger candidates.
Inference time was measured as the total time needed to predict the same 450-image test set once. Per Image Time is that total divided by the number of test images. These numbers are useful for relative comparison between models. Actual API latency would depend on server hardware, batch size, and preprocessing.
| Model | Val Accuracy | Test Accuracy | Training Time | Inference Time | Per Image Time |
|---|---|---|---|---|---|
| DenseNet201 | 0.8988 | 0.9067 | 111.38s | 3.3523s | 0.007450s |
| Xception | 0.8815 | 0.9000 | 62.02s | 3.5610s | 0.007913s |
| MobileNetV2 | 0.9062 | 0.8956 | 48.22s | 3.3096s | 0.007355s |
| ResNet50V2 | 0.8963 | 0.8933 | 41.77s | 3.3293s | 0.007399s |
| DenseNet121 | 0.8741 | 0.8822 | 86.92s | 3.3616s | 0.007470s |
DenseNet201 had the highest test accuracy. It also had longer inference and training time. MobileNetV2 was slightly below 90% test accuracy, but its validation accuracy was above 90% and it had the shortest inference time.
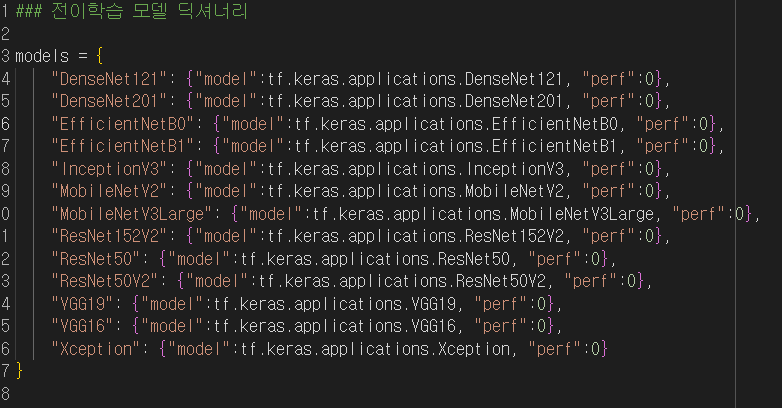
Why I chose MobileNetV2
I chose MobileNetV2 for three reasons.
First, the accuracy was high enough. MobileNetV2 reached 90.62% validation accuracy and 89.56% test accuracy. It was very close to the 90% target, and the practical difference from the other candidates was small.
Second, inference time was the shortest. Total inference time on 450 images was 3.3096 seconds, or 0.007355 seconds per image. Since this classifier is only a routing step before virtual try-on, saving time here fits the user experience better.
Third, training time was also short. At 48.22 seconds, it was lighter to iterate on than models with similar performance. That mattered for experiment speed and operating cost.
Additional evaluation
After training MobileNetV2 for seven more epochs, I checked class-level precision, recall, and F1 score.
| Class | Precision | Recall | F1-Score |
|---|---|---|---|
| Accessories | 0.93 | 0.93 | 0.93 |
| LongPants | 0.94 | 0.94 | 0.94 |
| LongSleeve | 0.77 | 0.84 | 0.80 |
| Outerwear | 0.95 | 0.79 | 0.86 |
| Shoes | 0.98 | 0.97 | 0.98 |
| ShortPants | 0.92 | 0.94 | 0.93 |
| ShortSleeve | 0.90 | 0.90 | 0.90 |
| Sleeveless | 0.89 | 0.94 | 0.91 |
The final metrics were:
| Metric | Result |
|---|---|
| Accuracy | 90.89% |
| Weighted Precision | 91% |
| Weighted Recall | 91% |
| Weighted F1-Score | 91% |
Visualization results
Over seven epochs, training accuracy reached 98.51% and validation accuracy reached 91.60%.
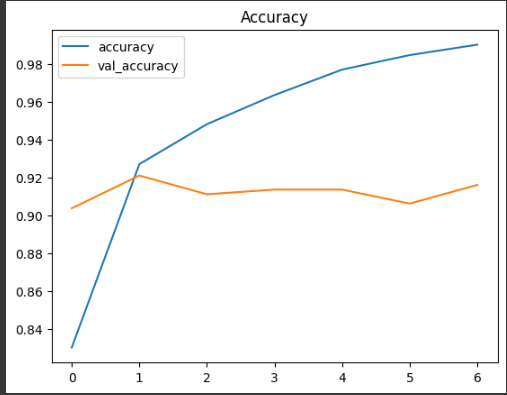
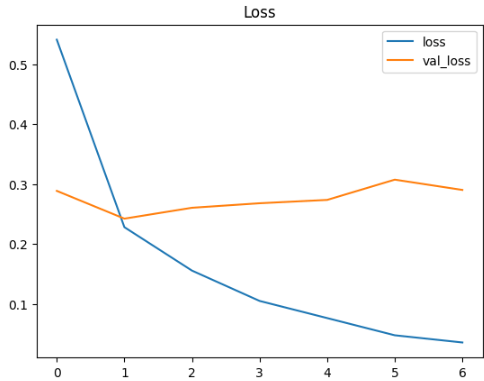
Both training loss and validation loss decreased steadily. There was some overfitting, but this dataset was close to the target shopping-mall image domain, so I did not treat it as a blocker at the time.
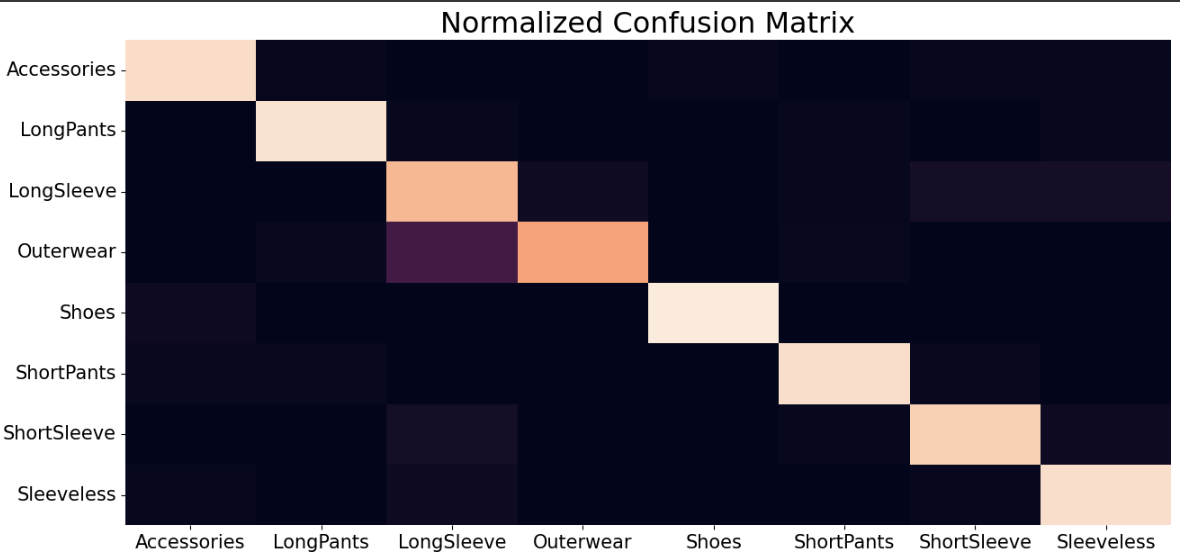
The confusion matrix showed some confusion between LongSleeve and Outerwear. In ThatzFit's business logic, however, both can route to a tops virtual try-on flow. From the model's point of view, that is a misclassification. From the product routing point of view, it is not necessarily a critical failure.
Deployment shape
I saved both the full model and the weights file so the server could load them.
model.save("mobilenet_v2_fashion_classifier.h5")
model.save_weights("mobilenet_v2_fashion_classifier.weights.h5")
This is simple for an early deployment. For real operation, model file versioning, fixed image preprocessing, fixed class label mapping, and reproducible inference environments would need to be managed together.
What I learned
The important lesson from this experiment is that "highest accuracy" is not always "best choice." DenseNet201 had higher test accuracy, but ThatzFit's bottleneck is virtual try-on, not garment classification. The classifier needs to be accurate enough and fast.
Another lesson is that misclassification cost cannot be judged from model metrics alone. LongSleeve and Outerwear confusion is a loss in the classification report, but if both route into the same tops fitting flow, the product impact is smaller. Model evaluation should be read together with downstream product behavior.
How I will judge this next time
For models used in downstream routing, I will not choose by top accuracy alone. First, I will identify which mistakes become actual user failures, then separate critical failures from acceptable confusion.
MobileNetV2 was the best-balanced choice between accuracy and inference time. The final test accuracy reached 90.89%, and weighted precision, recall, and F1 score were all around 91%. The next step is not just improving model metrics. It is measuring how often routing failures happen on real service inputs. If critical misclassifications accumulate in operation data, I would revisit class grouping and fallback policy before tuning augmentation or hyperparameters.